We have recently implemented a solution to integrate code coverage results into Phabricator.
Coverage information is uploaded either automatically for revisions after they are landed in mozilla-central (for example for release managers when looking at uplift requests), or on-demand for in-progress revisions.
For revisions under review, in order to upload coverage you just need to trigger a try push containing code coverage builds and tests, e.g. by using:
$ mach try fuzzy --full
and selecting the relevant ccov builds and test suites. In the future, we will also likely automatically trigger coverage try builds for revisions we deem to be risky, alongside the on-demand option.
Here is an example of a try build which produced the coverage information for my revision:

Once the try build and linked tests finish, the coverage artifacts get parsed and uploaded to the Phabricator revisions corresponding to the commits in the try push. The analysis works on all commits in the try push that are linked to Phabricator revisions. Stacks of revisions are supported as well.
The coverage information is shown on Phabricator both at a high-level view, in the Revision Contents section, and at a detailed view in the Diff section.
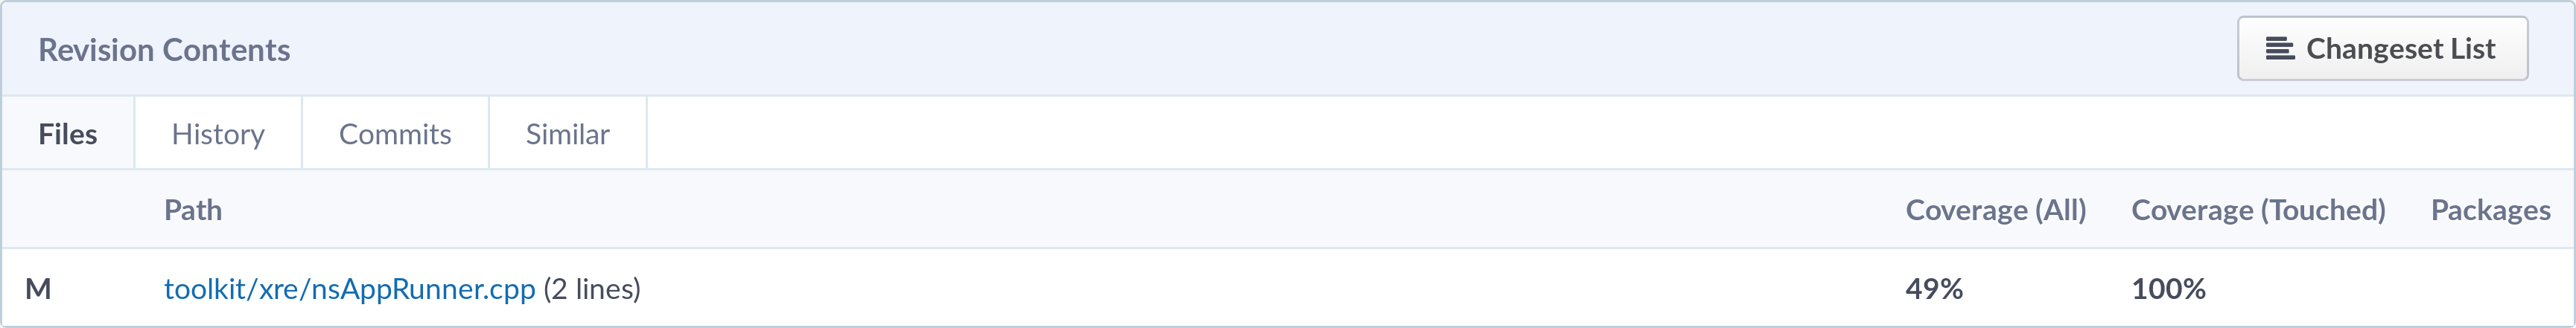
The Revision Contents section contains a list of the files modified by the revision, showing both the coverage percentage of the whole file and the coverage percentage of touched lines. Here’s the screenshot of the section from my revision:
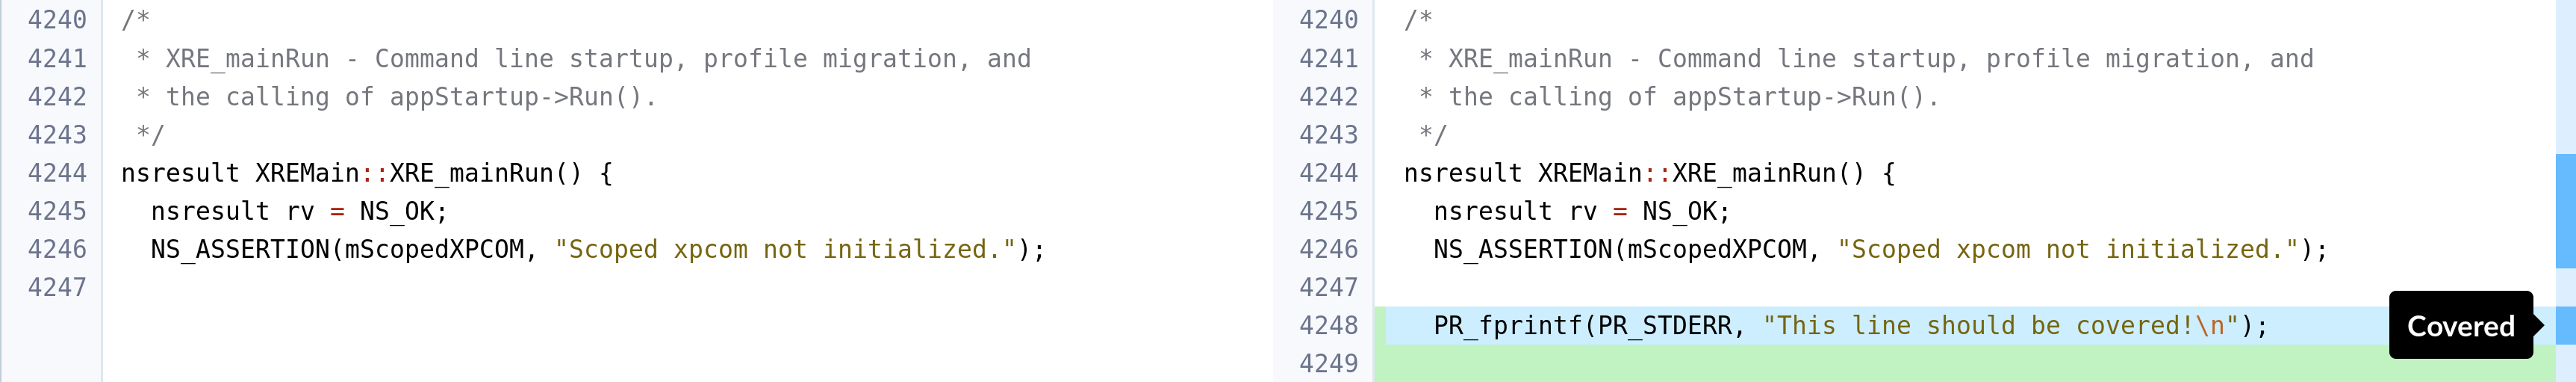
The Diff section instead shows the coverage line per line, coloring the bar on the right-hand side. Orange corresponds to uncovered lines, light blue corresponds to non-executable lines (e.g. a comment, a definition, and so on), dark blue corresponds to covered lines. When hovering the bar, the corresponding line is highlighted in the same color. The following screenshots show excerpts of my revision, with covered, uncovered and non-executable lines: